snotelpy
A modern Python interface for USDA SNOTEL data.


Why snotelpy?
The NRCS is transitioning away from the legacy WSDL/SOAP API toward a modern
RESTful interface. No actively maintained Python package exists for it yet.
snotelpy fills that gap — clean xarray Datasets, automatic chunking for large
requests, and built-in spatial filtering by HUC watershed, county, or station name.
Install
pip install snotelpy
Quick Example
import snotelpy as sp

ds = sp.fetch_snotel(
    stations=["602:CO:SNTL", "913:CO:SNTL"],
    elements=["WTEQ", "SNWD"],
    start_date="2022-10-01",
    end_date="2023-06-30"
)

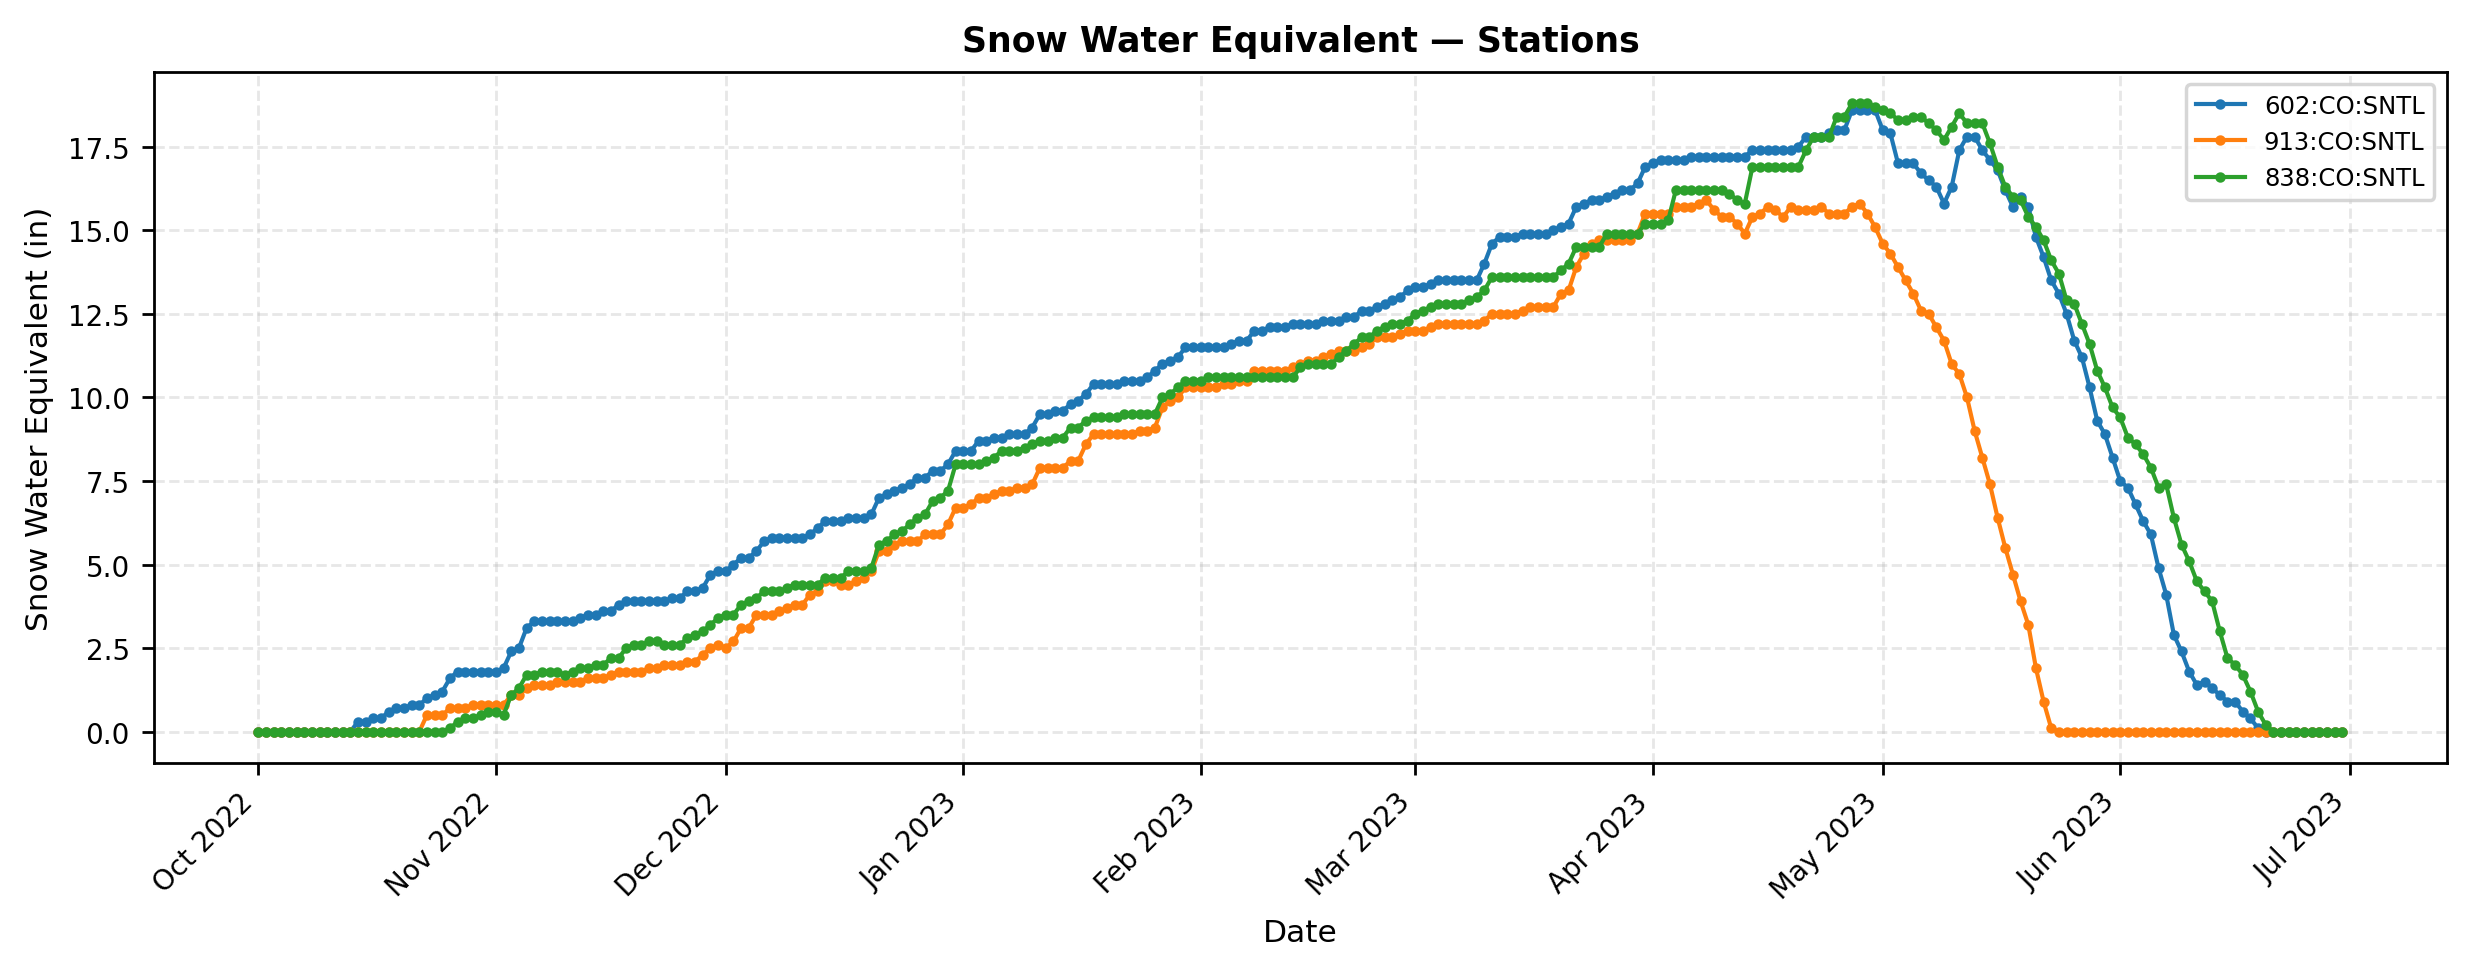
sp.plot.element_timeseries(ds, element="WTEQ")
Basin Summary Example
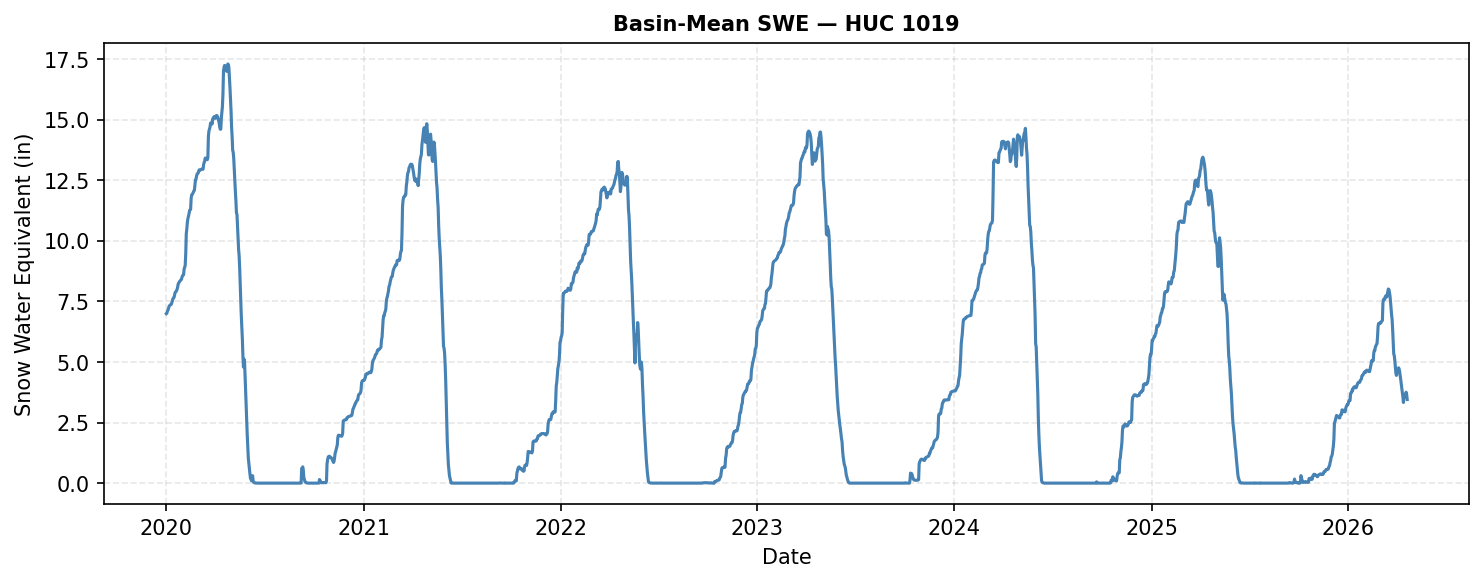
out = sp.basin_summary(
    hucs=[1019],
    elements=["WTEQ"],
    duration="MONTHLY",
    start_date="2000-10-01",
    end_date="2025-10-01",
    climatology_period=("2000-10-01", "2025-10-01")
)

# Basin-averaged SWE statistics (MEAN, MEDIAN, MAX, MIN) x time
print(out["basin_stats"])

# Monthly climatology
print(out["climatology"])

# All stations in the basin as a GeoDataFrame
print(out["stations"].head())
What you can do
- Fetch daily, hourly, or monthly data for any SNOTEL station or wildcard
- Filter stations by HUC watershed, county, or element availability
- Summarize entire basins with mean, median, max, min, and monthly climatology
- Plot multi-station time series with one line
- Save directly to NetCDF, GeoJSON, or .CSV
Data Source
Data is retrieved live from the USDA NRCS AWDB REST API.
Full API Reference
See the API docs for complete parameter documentation.